We Have Formulated a Guideline for Creating a Multicultural Society in Mie Prefecture (2nd edition)

三重県多文化共生社会づくり指針(第2期)を策定しました

2020/04/03 Friday Announcements

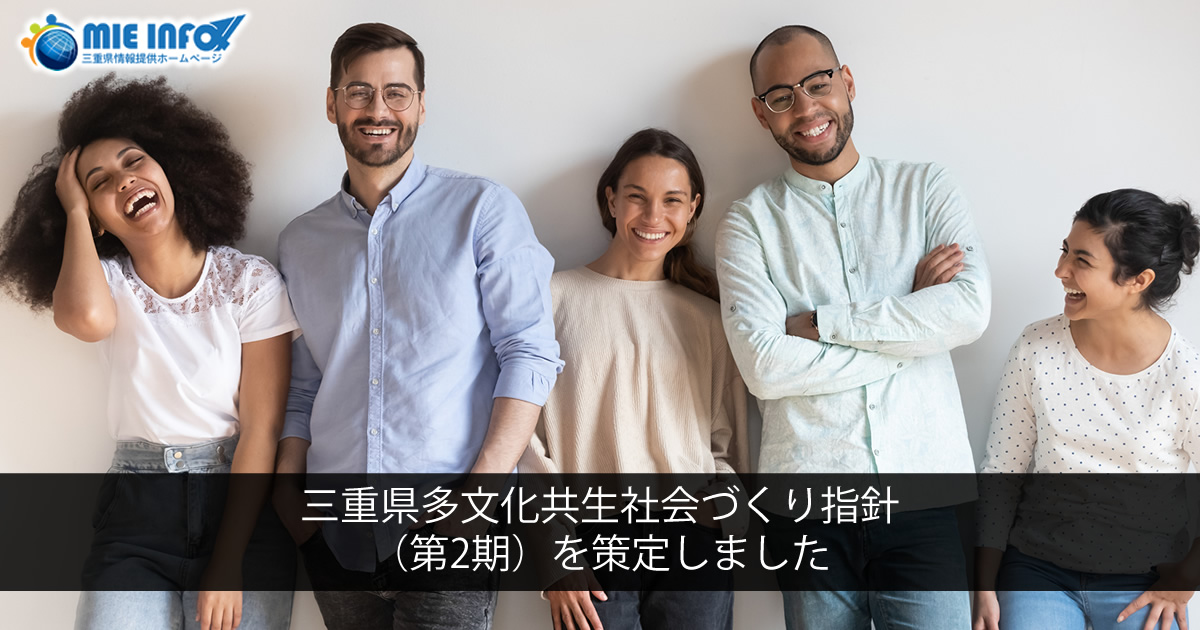
In March 2016 (Heisei 28), the Guidelines for Creating a Multicultural Society in Mie Prefecture (2nd edition) were closed at the end of 2019 (Reiwa 1).  For this reason, the 2nd edition of the Guidelines for Creating a Multicultural Society in Mie Prefecture was defined based on the social circumstances related to multicultural coexistence.

The period will be between the fiscal years 2020 (Reiwa 2) and 2023 (Reiwa 5), ​​totaling of 4 years.

Based on these guidelines, Mie Prefecture will continue efforts to create a multicultural society.

See below for details in several languages.

JapanesePortugueseSpanishFilipinoChineseEnglish

See the homepage of the city hall

http://www.pref.mie.lg.jp/TOPICS/m0011500245.htm

The number of foreign residents in the prefecture has increased to 55,208 (+ 9.1% over the previous year)

2020/04/03 Friday Announcements

県内の外国人住民数が55,208人(前年比+4,596人、+9.1%) に増加し、過去最高を更新しました

Results of Foreign Residents Citizenship / Regional Population Survey (December 31, 2019)

Mie prefecture conducts surveys once a year on the number of foreign residents.

The outline of the survey results is as follows. For details, please see the website of Mie Ken Diversity Shakai Suishin-ka (only in japanese).
http://www.pref.mie.lg.jp/TOPICS/m0011500242.htm

Survey Result

  1. Number of foreign residents in Mie prefecture as of the end of 2018
    55,208 people (4,596 people, up 9.1% over the previous year)
    * 6 consecutive years of increase from 2013.
  2. Percentage of foreign residents in total prefecture population
    3.04% (2.77% in the previous year)
    * Ito ay lumampas sa talaan ng 2.78% noong 2008.
  3. Number of foreign residents by nationality / region
Ranking Country Number of foreign residents Ratio Increase/Decrease number Ratio of change
1 Brazil 13,300 24.1% 421 3.3%
2 Vietnam 8,310 15.1% 2,350 39.4%
3 China 8,277 15.0% 339 4.3%
4 Philippines 7,315 13.2% 411 6.0%
5 South Korea 4,309 7.8% -104 -2.4%
6 Peru 3,053 5.5% -21 -0.7%
7 Indonesia 1,877 3.4% 263 16.3%
8 Thailand 1,693 3.1% 181 12.0%
9 Nepal 1,511 2.7% 290 23.8%
10 Bolivia 970 1.8% 6 0.6%
Others 4,593 8.3% 460 11.1%
Total 55,208 100.0% 4,596 9.1%
  1. Number of foreign residents by city and town Top 10 Municipalities
Ranking City Number of foreign residents Ratio Increase/Decrease number Ratio of change
1 Yokkaichi 10,526 19.1% 924 9.6%
2 Tsu 9,234 16.7% 596 6.9%
3 Suzuka 8,658 15.7% 449 5.5%
4 Iga 5,715 10.4% 385 7.2%
5 Kuwana 4,642 8.4% 555 13.6%
6 Matsusaka 4,595 8.3% 276 6.4%
7 Inabe 2,216 4.0% 303 15.8%
8 Kameyama 2,089 3.8% 138 7.1%
9 Ise 1,095 2.0% 160 17.1%
10 Nabari 1,088 2.0% 225 26.1%
  1. Percentage of the number of foreign residents by city town Top 10 municipalities
Ranking Municipality Name Ratio of foreigners Number of foreign residents Japanese population
1 Kisosaki 7,45% 466 5,791
2 Iga 6,26% 5,715 85,511
3 Inabe 4.85% 2,216 43,497
4 Suzuka 4.33% 8,658 191,228
5 Kameyama 4,20% 2,089 47,629
6 Kawagoe 3,83% 583 14,644
7 Yokkaichi 3,38% 10,526 301,025
8 Tsu 3,32% 9,234 268,871
9 Kuwana 3,27% 4,642 137,377
10 Matsusaka 2,81% 4,595 158,882
Total 3,04% 55,208 1,758,611